
Technical indicators can be very confusing and daunting for beginner traders. They don’t have to be, and in this video give you a basic understanding of them as useful technical indicators to help you make profit in the markets. Firstly, all the indicators we are going to show you or created from basic candlestick data. They all take their information from the basic price action.
2Moving Average Convergence Divergence (MACD)
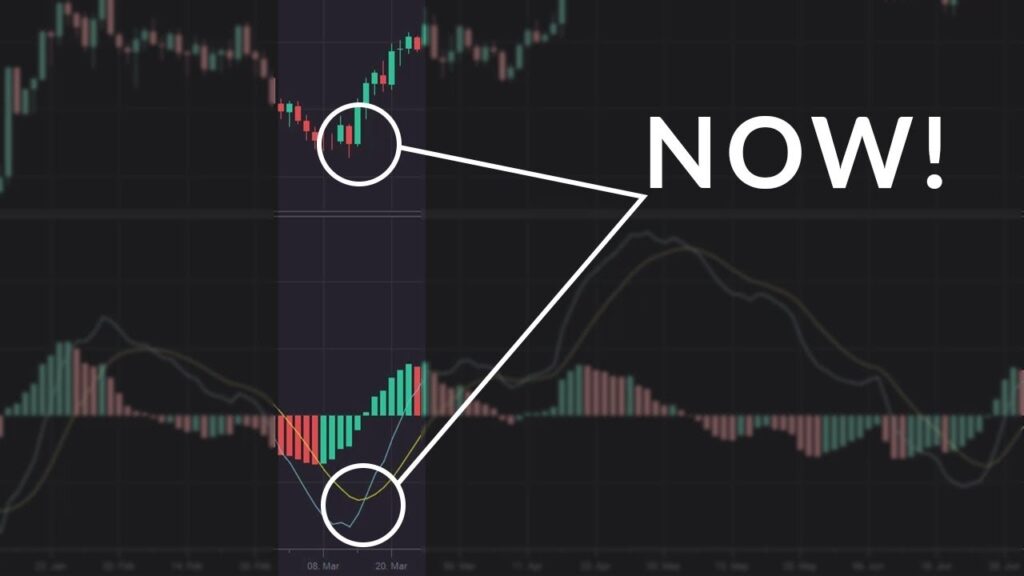
The Moving Average Convergence / Divergence is one of the most well known and used indicators in technical analysis. This indicator is made up of two exponential moving averages which help measure momentum and an instrument. These moving averages and the changing distances between them become the MACD.
When the shorter-term moving average is above the longer-term moving average this area of the indicator will show activity when the shorter-term moving average is below the longer-term moving average, this area of the indicator will show activity. Typical values for the MACD are 26 and 12 exponential moving averages, and 9 for the signal line. The farther apart the moving averages and the greater the momentum, the farther away the MACD will be from the centre line. Traders use the MACD and signal line crosses, such as these, to indicate momentum trades. You can see how these crosses often match up with market moves. Traders also use the MACD crosses to indicate where momentum is coming out of the market and may use it is a signal to exit a trade.


