
Technical indicators can be very confusing and daunting for beginner traders. They don’t have to be, and in this video give you a basic understanding of them as useful technical indicators to help you make profit in the markets. Firstly, all the indicators we are going to show you or created from basic candlestick data. They all take their information from the basic price action.
3Bollinger Bands
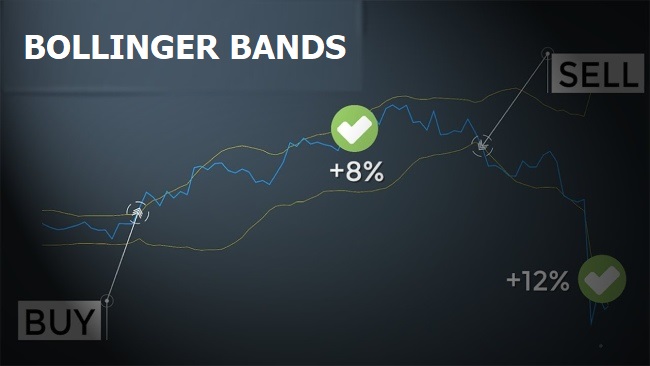
A Bollinger Band starts off a simple moving average it then has two standard deviations plotted away from it. Now sounds a mouthful, but the important part is because standard deviation is a measure of volatility, Bollinger Bands adjust themselves to current market conditions. When the markets become more volatile, the bands widen and move further away from the average. During less volatile periods the bands contract, moving closer to the average.
The tightening of the bands is often used by technical traders as a early indication that volatility is about to rapidly increase as volatility often follows periods of lack of volatility. The market spent most of the time within the bands and when the price action reaches the edge of the bands, it is often more likely to reverse and come back into the range. This is used as a signal by reversal traders to take a trade.


