
Technical indicators can be very confusing and daunting for beginner traders. They don’t have to be, and in this video give you a basic understanding of them as useful technical indicators to help you make profit in the markets. Firstly, all the indicators we are going to show you or created from basic candlestick data. They all take their information from the basic price action.
1Relative Strength Index (RSI)
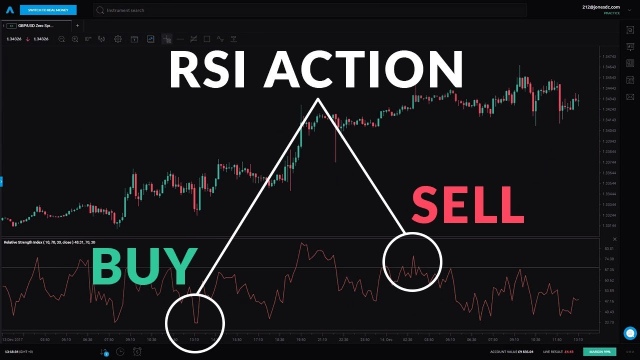
The Relative Strength Index compares the magnitude of recent gains to recent losses in an attempt to determine overbought and oversold conditions of instrument. As you can see from the chart, the RSI ranges from 0 to 100. An instrument is deemed to be overboard once the RSI approaches a 70 level meaning that it may be getting overvalued and is a good candidate for a pullback or reversal.
Likewise, if the RSI approaches 30 is an indication the instrument may be getting oversold and therefore likely to reverse. Traders will often use the RSI either coming back out to its overbought or oversold areas as a signal or partial signal to enter a trade. Sometimes the RSI levels can be 80 and 20, for high volatile stocks.


