
Technical indicators can be very confusing and daunting for beginner traders. They don’t have to be, and in this video give you a basic understanding of them as useful technical indicators to help you make profit in the markets. Firstly, all the indicators we are going to show you or created from basic candlestick data. They all take their information from the basic price action.
5Confluence
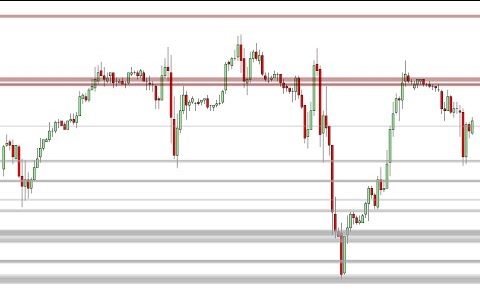
The last indicator isn’t a new one it’s indicated confluence,which means to use multiple indicators and their signals to take a trade. Here we have the RSI and MACD we looked at with the RSI moving into overbought territory here. Remember, that indicates the market will reverse. However, we want to help us filter out false signals on the RSI so we also look at the MACD to give us confluence.
We can see is indicating the momentum has come out of the market as far as the market rallying or going up is concerned. And we have an MACD cross here. A signal to enter this short trade could be waiting for the RSI sights come back out of the overbought, and also waiting for the MACD cross.


